Pivotal Tracker is a great lightweight tool for running distributed Scrum. It's free and I use it for my company and my wife has used it for
Scrum in Church. Ward Cunningham says it is the only tool that is as good as cards. Well, maybe not as good as a Scrum Board but close. OpenView Venture Partners recommends it for portfolio companies not ready to move up to Version One, a tool provided by one of our portfolio companies.
I met Dan Podsedly for the second time at Agile 2009 to discuss how new features are supporting Scrum. Key issues are the Burndown Chart and handling large stories (Epics) that need to be broken into smaller stories without losing the relationships.
The Burndown Chart is here and it is a nice one that shows the flow of stories from state to state.
-----
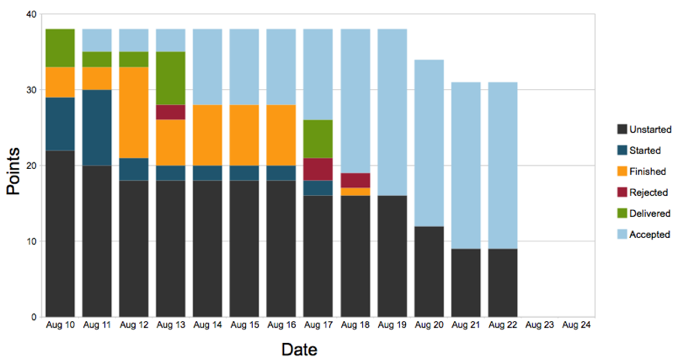
New Pivotal Tracker feature: Points Breakdown Chart
Posted by Dan Podsedly on Sunday August 23, 2009 at 08:32PM
We've added a new report feature to Pivotal Tracker, to help you analyze how smoothly your project is progressing. It's based on this popular idea, shared in our Get Satisfaction powered support community.
These new Points Breakdown charts help you visualize the progress of your project as stories move through different stages of completion. Stories start out as "Unstarted", then move on to "Started", "Finished", "Delivered", and then "Accepted" (unless they get rejected). The different colored bars show the point totals of the stories that are in each state at the end of each day. As days pass, you would expect the number of unstarted to go down, and the number of accepted to go up. If any of the other groups are especially big, the chart may help you identify bottlenecks in your workflow.
 Scrum is an Agile development framework that Jeff Sutherland invented at Easel Corporation in 1993. Jeff worked with Ken Schwaber to formalize Scrum at